Pressure Drop in Plate Heat Exchangers for Single-Phase Convection in Turbulent Flow Regime: Experiment and Theory Part 1

Abstract
Plate heat exchangers (PHEs) play an important role in different technical fields, namely, in energetics, chemical industry, food industry, and others. To use PHE effectively, it is necessary to have correct data for pressure drop. Unfortunately, in open literature, a large difference among different authors occurs. In this work is shown that an essential portion of this difference lies in the choice of the typical length for the calculation of the friction coefficient. Care must be taken to consider the pressure drop of the distribution zone. A three-component model for hydraulic resistance of PHE in turbulent flow regime is proposed in this work. The proposed model shows good agreement with experimental data.
International Journal of Chemical Engineering
Volume 2019, Article ID 3693657, 11 pages       https://doi.org/10.1155/2019/3693657
1. State of Research
Plate heat exchangers (PHE) are widely used in industry. A compact size due to high heat transfer coefficients is one major advantage over other heat exchanger types like shell and tube type. The special design of the flow channels results in early transition from laminar to turbulent flow and significant increase in heat transfer coefficients. Unfortunately, this comes along with an increase in pressure drop compared to flat channels, too. A reliable model for pressure drop calculation is required for a successful use of PHE.
The following model is traditionally applied to present experimental data of a PHE:where is the pressure drop in a channel of a PHE, is the average velocity in a channel, is the effective length of the PHE, is the equivalent diameter of a channel, and is the Fanning friction factor or Fanning factor in a channel.
In literature, the model according to equation (1) is widespread [1–19]. The Fanning friction factor is a function of Reynolds number and is presented in graphical or analytical form. If Fanning factors were found for a specific unit, this model can reproduce the specific unit’s pressure drop within 10% to 20% margin. Applied to a PHE with different geometries, the margin of deviation can be much higher. Fanning factors calculated with models of different authors can vary by up to 50–100%. Therefore, Fanning factors found for one plate type are mostly valid only for its specific design. Applications of equation (1) to various PHEs are stated in textbooks of Wang et al. [20] and Klemes et al. [21]. Some results cannot be explained well according to equation (1). The study [2] is a good example: it shows different correlations for refrigerants R 245fa and R 236a in turbulent flow regime for the same PHE. This means that equation (1) cannot always consider a strong influence of physical properties correctly.
Two citations of recent publications summarize the state of the art very well:(i)“Most of the previously reported empirical correlations are restricted to specific experimental geometry and flow conditions and cannot be generalized for all PHE applications” [9].(ii)“It can be seen from the experimental studies…, a general correlation applicable to all chevron angle even with the same chevron angle is not possible. A gasketed plate heat exchanger design continues to be proprietary in nature; the correlations obtained are applicable to this exchanger that is marketed” [12].
Several attempts of creating a generalized theory were made in the past. Especially, Dovic et al. [7], Martin [14], Muley and Manglik [16], Klemes et al. [21], and Arsenyeva et al. [22] deserve attention. The most physically reasonable approach is the three-component model proposed by Arsenyeva et al. [23].
This work is dedicated to study the influence of reference length L on the pressure drop of a PHE. At first, it is shown that usage of the model according to equation (1) results in Fanning factors that always depend on effective length L. Subsequently, the three-component model proposed by Arsenyeva et al. [23] is enhanced. It divides the channel in the two distribution zones—at the inlet and outlet of a channel—and the corrugation field in the middle of a channel. Each of the three zones of the channel has its own friction factor correlation. Furthermore, it is shown that the corrugation field correlation has universal characteristics and is independent of its length in turbulent regime.
2. Experimental Setup and Procedure
Experimental setup involves three PHEs (warm-side setup, test set, and cold-side set-up), arranged in two closed loops, as shown in Figure 1.

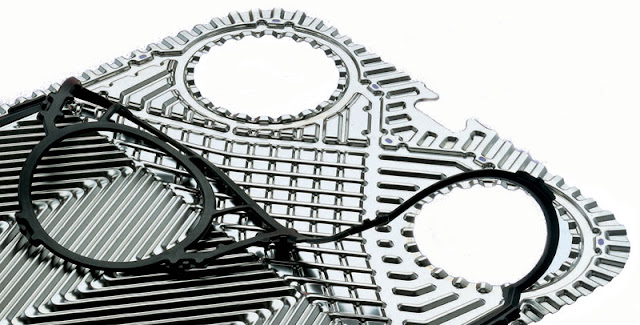
On the warm side, a pump circulates the warm fluid (water or ISO VG46 Oil). The warm fluid is heated by using a boiler. On the cold side, three air coolers maintain a constant temperature of the fluid (water or glycol). A fully automatic control unit adjusts the temperature and flow rates to comply with the set values. As test PHE were used four plate heat exchangers of FUNKE Wärmeaustauscher Apparatebau GmbH (Germany) [24]. One of these plates is shown in Figure 2.

The geometric parameters of a plate are illustrated in Figure 3, and the geometric values for plates P1–P4 are shown in Table 1.


Every device could have one of the three chevron patterns: HH (with chevron angle φ = 63°), HL (with chevron angle φ = 63°/27°), and LL (with chevron angle φ = 27°).
All four plates are similar, and only the length of the corrugated field varies. In Figure 4, the test set with test PHE is shown.

Platinum resistance thermometers Pt1000 (T1–T4) are used to measure the fluid temperatures at the inlet/outlet of the test PHE with the measurement error ±(0.15 K + 0.002 t). To improve the precision of the sensors, we calibrate all temperature sensors simultaneously at the area of working temperature. The deviation of measured temperature of all sensors is about 0.05–0.1 K. The flow rates in the test section are measured by volumetric inductive flow meters of type KROHNE OPTIFLUX 4300 (MF1 and MF2) with a measurement error of ±1% for measuring range 3–500 m³/h. Static mixers are used to reduce local temperature variations. Static mixers (2 and 4) at outlets are basically used, mixers (1 and 3) at inlets if necessary. The pressure losses of the fluid flowing through the test section is measured with a differential pressure transmitter model DPT10 (PD1 and PD2) with the measurement error of ±0.2%. The two devices are used for measuring ranges 0–500 mbar and 0–3 bar. Pressure at the inlet of PHE is measured with the pressure transmitter (P1 and P2) with the measurement error of ±0.2%.
The values are measured as close as possible to the test PHE, taking care to use calibrated measurement pipes (length/diameter ≥ 10). The test PHE was configurated as a single-pass U-type counterflow device. The corrugation profile of the plate is given in Figure 5. It is close to sinusoidal.

All data were obtained under steady-state conditions with close energy balance (less than ±5% difference between the measured performance of warm and cold side). A constant inlet temperature (≈60°C) for the hot fluid was maintained throughout each set of experiments. The inlet temperature of the cold fluid was constant (≈40°C), too. All sensors and measuring equipment are calibrated accordingly to standard ISO 9001 : 2008.
3. Data Reduction
The primary measurements of each fluid consist of the flow rate, inlet and outlet temperatures, pressure drop between the inlet and outlet of the PHE, and inlet pressure for every side. The channel flow Reynolds number is based on the equivalent diameter De:
All fluid properties were calculated at the bulk-mean temperature given by
From the measured overall pressure drop across the PHE , the pressure drop in the channel can be obtained from the following equation:
For the port, pressure drop according to [17] is used:
The pressure loss in inlet and outlet pipe was estimated on the basis of the smooth tube friction factor, and local pressure losses on the sudden area changes. The pressure loss considers the distance of pressure sensors to PHE.
The Fanning friction factor was calculated as
The choice of effective length of the PHE L is discussed later.
The experimental uncertainties were determined by the procedure outlined by [25]. The maximum errors in the primary measurements of flow rate , pressure drop Δp, and temperature T were ±1%, ±0.2%, and ±(0.15 K + 0.002 T), respectively. Based on these measurement uncertainties and the propagation of error analysis, the uncertainties in Reynolds number Re and Fanning friction factor f were 5.7% and 9.2%, respectively.
4. Experimental Results
For the valid presentation of the data for the pressure losses in the channel of PHEs, the choice of the characteristic length L of the PHEs is important. In common use is the vertical distance between holes in the plate Lport [14, 16]:
The authors [10] consider the choice:

By increase in chevron angle φ, the hydraulic resistance in the channel increases and transition to turbulence is displaced to smaller Reynolds numbers.
Figure 7 illustrates experimental data in the turbulent zone for all four PHE P1–P4 with chevron pattern HH and data of other authors.

In the turbulent zone, it is obvious that data depend on plate length Lport: the higher the length is, the higher the Fanning friction factor is. The shortest plate P1 has the smallest friction factor. The dependence of friction factor fch(Lport) on the relative length of a plate Lport/Bch is confirmed by comparison of our experimental data with literature, too. Our data for the long plates P3 (Lport/Bch = 3.69) and P4 (Lport/Bch = 4.73) agree well with the data of Bond [4], Heavner [12], and Thonon [19], who investigated industrial PHEs. Data for our shorter plates P1 (Lport/Bch = 2.06) and P2 (Lport/Bch = 2.86) are considerably lower.
The same characteristic behavior can be observed for data of other authors. Fanning factor f is the highest in the publication of Focke et al. [9] who used a plate with Lport/Bch = 4.0. Data for a plate with Lport/Bch = 3.57 from Shaji and Das [18] are lower and agree well with our data for plate P3 (Lport/Bch = 3.69). Fanning factors of Lee et al. [13] for a plate with Lport/Bch = 2.94 are approximately the same as our data of plate P2 (Lport/B = 2.86). Muley and Maglik [16] investigated a plate with Lport/Bch = 2.4 and received considerably lower Fanning factors compared to all other mentioned authors.
In Figure 8, experimental data for plates P1–P4 with chevron pattern LL are compared to data of other authors. For corrugation angle φ = 27° (LL), the dependence on the length Lport changes in comparison with HH. For LL chevron pattern, Fanning factors decrease by increase in length Lport. Therefore, in Figure 8, the values of the shortest plate P1 are the biggest ones and values for longest plate P4 are the smallest ones.

As before, our experimental data are consistent with the data of Bond [4], Heavner [12], and Thonon [19]. Generally, variation between the correlations has increased. A relatively high influence of distribution zone on channel pressure drop for LL pattern seems to be a probable cause of this behavior.
Data of Focke et al. [9] (L/B = 4.0) are now in the range of the lowest data. Fanning factors of Shaji and Das [18] for a plate with Lport/Bch = 2.4 are the second highest now. The proportionality of the Fanning factor and plate length is not as expected for data of Shaji and Das [18]. This may be caused by different geometries of the distribution zones.
5. Three-Component Model
The typical approach (equation (6)) to make a connection between hydraulic resistance and characteristic length of the plate leads to length-dependent Fanning friction factors. The resulting correlations are of opposite behavior for low and high (LL and HH) chevron angles. It is caused by a different character of the flow in all three characteristic zones—inlet and outlet distribution zone and corrugated field. Due to this, the idea of Arsenyeva et al. [23] to divide a plate in three areas and describe the friction factor independently for each area seems reasonable.
A main challenge of a three-component model is the complexity of measurements for all components. A calculation-based approach to determine the different parts of the pressure drop is an alternative to measurements. This is possible if experimental data for one series of plates (equal corrugation type, distribution zone, and width) with different lengths of the corrugated field are available.
From experimental data, the pressure drop of a channel ∆pch is received. At first, data for a low corrugation angle (LL) are used. The turbulent flow region is initially considered because of very limited amount of data in laminar region. A dimensionless form of the channel pressure drop is introduced:
The channel pressure drop ∆pch consist of three components in this model:with pressure drop of the corrugated field ∆pch and pressure drop of the inlet ∆pinlet and outlet ∆poutlet distribution zone. Each component is described as follows:
continue

Commenti
Posta un commento